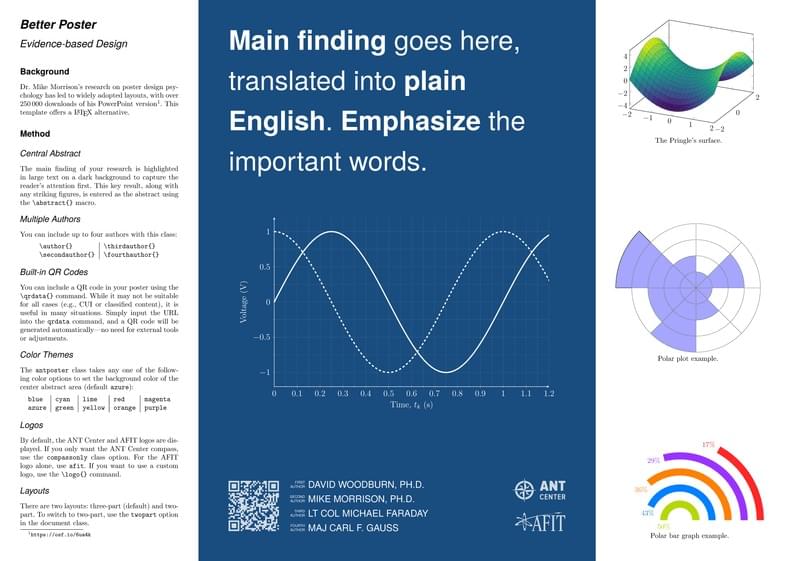
ANT Center Poster
Author:
David Woodburn
Last Updated:
a year ago
License:
Creative Commons CC BY 4.0
Abstract:
Poster template for the ANT Center.

\begin
Discover why over 25 million people worldwide trust Overleaf with their work.

\begin
Discover why over 25 million people worldwide trust Overleaf with their work.
\documentclass[]{antposter}

% Poster metadata
\title{Better Poster}
\subtitle{Evidence-based Design}
\author{David Woodburn, Ph.D.}
\secondauthor{Mike Morrison, Ph.D.}
\thirdauthor{Lt Col Michael Faraday}
\fourthauthor{Maj Carl F. Gauss}
% Multiple lines must be separated by '\?'.
\qrdata{https://youtu.be/SYk29tnxASs?si=drWywhECG4VRmiCW}
\abstract{
    \textbf{Main finding} goes here, translated into \textbf{plain
    English}. \textbf{Emphasize} the important words.

    % Graphic
    \vspace{2.0cm}\normalsize\centering
    \begin{tikzpicture}
        \newlength{\Width}\setlength{\Width}{\textwidth}
        \addtolength{\Width}{-1.5cm}
        \begin{axis}[
                width=\Width, height=10cm,
                axis lines=left, grid=both,
                xmax=1.2, enlarge y limits=true,
                minor tick num=1,
                xlabel={Time, $t_k$ (s)},
                ylabel={Voltage (V)}]
            \addplot[ultra thick, white, domain=0:2, samples=120]
                {sin(360*\x)};
            \addplot[ultra thick, white, dashed, domain=0:2, samples=120]
                {cos(360*\x)};
        \end{axis}
    \end{tikzpicture}
}

\begin{document}
\maketitle

\section{Background}

Dr. Mike Morrison's research on poster design psychology has led to widely
adopted layouts, with over 250\,000 downloads of his PowerPoint
version\footnote{\url{https://osf.io/6ua4k}}. This template offers a \LaTeX{}
alternative.

\section{Method}

\subsection{Central Abstract}

The main finding of your research is highlighted in large text on a dark
background to capture the reader's attention first. This key result, along with
any striking figures, is entered as the abstract using the \verb|\abstract{}|
macro.

\subsection{Multiple Authors}

You can include up to four authors with this class:
\begin{center}
\begin{tabular}{l|l}
    \verb|\author{}|       & \verb|\thirdauthor{}| \\
    \verb|\secondauthor{}| & \verb|\fourthauthor{}|
\end{tabular}
\end{center}

\subsection{Built-in QR Codes}

You can include a QR code in your poster using the \verb|\qrdata{}| command.
While it may not be suitable for all cases (e.g., CUI or classified content), it
is useful in many situations. Simply input the URL into the \verb|qrdata|
command, and a QR code will be generated automatically---no need for external
tools or adjustments.

\subsection{Color Themes}

The \verb|antposter| class takes any one of the following color options to set
the background color of the center abstract area (default \verb|azure|):
\begin{center}
    \begin{tabular}{l|l|l|l|l}
        \texttt{blue}  & \texttt{cyan}  & \texttt{lime}
            & \texttt{red}    & \texttt{magenta} \\
        \texttt{azure} & \texttt{green} & \texttt{yellow}
            & \texttt{orange} & \texttt{purple}
    \end{tabular}
\end{center}

\subsection{Logos}

By default, the ANT Center and AFIT logos are displayed. If you only want the
ANT Center compass, use the \verb|compassonly| class option. For the AFIT logo
alone, use \verb|afit|. If you want to use a custom logo, use the \verb|\logo{}|
command.

\subsection{Layouts}

There are two layouts: three-part (default) and two-part. To switch to two-part,
use the \verb|twopart| option in the document class.


\begin{tabular}{@{}c@{}}
    \begin{tikzpicture}[scale=0.9]
        \pgfplotsset{colormap/viridis}
        \begin{axis}[samples=20]
            \addplot3[surf, domain=-2:2] {x^2-y^2};
        \end{axis}
    \end{tikzpicture} \\
    The Pringle's surface.
\end{tabular}

% Macro to plot bars in polar coordinates
\vfill
\newcommand{\polarbar}[3]{
    \pgfmathsetmacro{\x}{#1*cos(#2)}
    \pgfmathsetmacro{\y}{#1*sin(#2)}
    \draw[fill=blue!50] (0,0) -- (\x,\y) arc[start angle=#2,
        end angle=#2+#3, radius=#1] -- cycle;
}
\begin{tabular}{@{}c@{}}
    \begin{tikzpicture}[scale=0.8]
        % Draw polar bars (radius, angle, angle span)
        \polarbar{3}{0}{45}
        \polarbar{1}{45}{45}
        \polarbar{2}{90}{45}
        \polarbar{5}{135}{45}
        \polarbar{3}{180}{45}
        \polarbar{4}{225}{45}
        \polarbar{2}{270}{45}
        \polarbar{1}{315}{45}

        % Draw polar grid
        \draw[gray, thin] (0,0) circle(4); % Max radius circle
        \draw[gray, thin] (0,0) circle(3); % Intermediate radius circle
        \draw[gray, thin] (0,0) circle(2); % Small radius circle
        \draw[gray, thin] (0,0) circle(1); % Smallest radius circle
        \foreach \angle in {0,45,...,315} {
            \draw[gray, thin] (0,0) -- (\angle:4); % Radial lines
        }
    \end{tikzpicture} \\
    Polar plot example.
\end{tabular}

\vfill
\begin{tabular}{@{}c@{}}
    \begin{tikzpicture}[scale=0.8]
        \path (-4,0) -- (5,0);
        \foreach \p/\C [count=\n] in {50/lime, 43/azure, 36/orange,
                29/purple, 17/red} {
            \pgfmathsetmacro{\ang}{3.6*\p}
            \pgfmathsetmacro{\rad}{1.0*\n}
            \draw[\C, line width=10pt] (\rad,0) arc (0:\ang:\rad)
                node[anchor={\ang-90}, inner sep=0pt]{\p\%};
        }
    \end{tikzpicture} \\
    Polar bar graph example.
\end{tabular}

\end{document}