overleaf template galleryLaTeX templates and examples — Recent
Discover LaTeX templates and examples to help with everything from writing a journal article to using a specific LaTeX package.
Fill the details accordingly
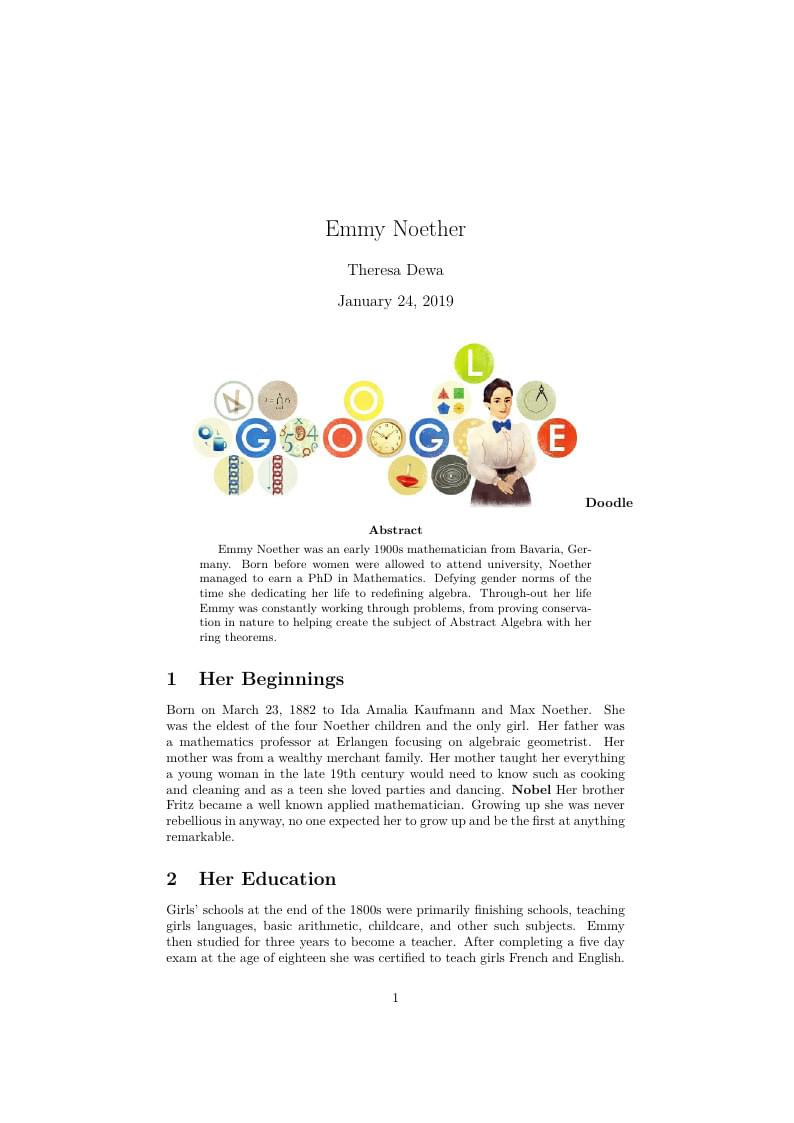
Short biography of mathematician Emmy Noether
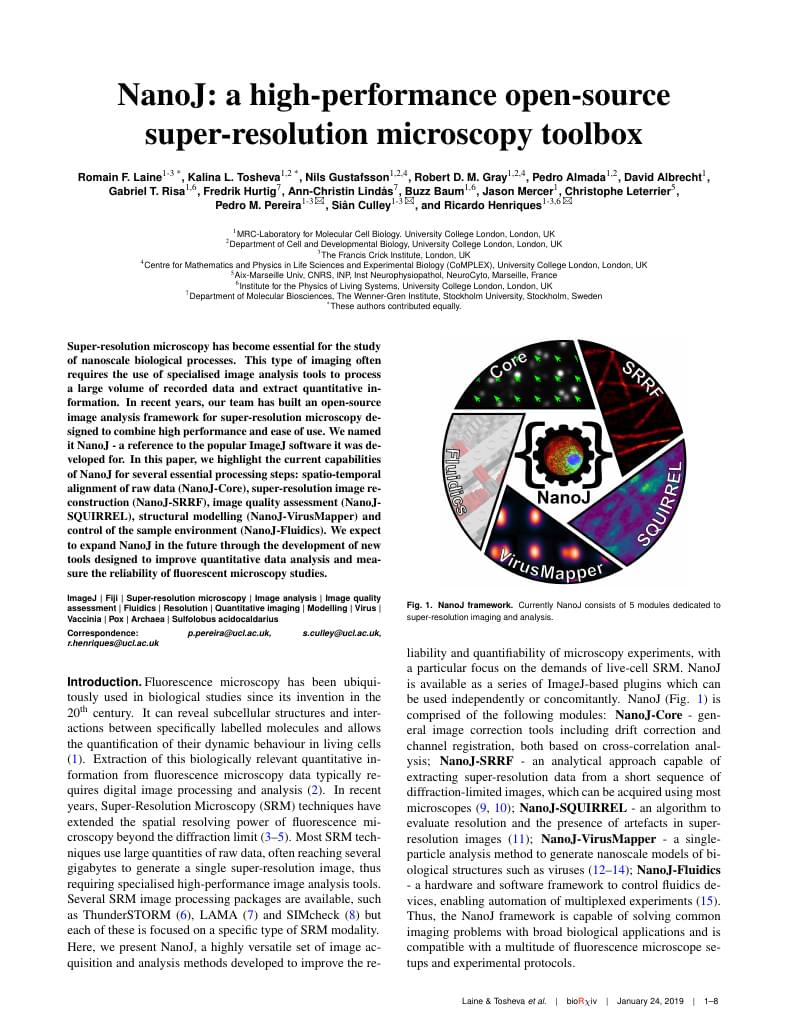
Super-resolution microscopy has become essential for the study of nanoscale biological processes. This type of imaging often requires the use of specialised image analysis tools to process a large volume of recorded data and extract quantitative information. In recent years, our team has built an open-source image analysis framework for super-resolution microscopy designed to combine high performance and ease of use. We named it NanoJ - a reference to the popular ImageJ software it was developed for. In this paper, we highlight the current capabilities of NanoJ for several essential processing steps: spatio-temporal alignment of raw data (NanoJ-Core), super-resolution image reconstruction (NanoJ-SRRF), image quality assessment (NanoJ-SQUIRREL), structural modelling (NanoJ-VirusMapper) and control of the sample environment (NanoJ-Fluidics). We expect to expand NanoJ in the future through the development of new tools designed to improve quantitative data analysis and measure the reliability of fluorescent microscopy studies.
This is a simple template that i used for my projects at the university. The most of it is in italian so you have to change languages set if you want to use it.
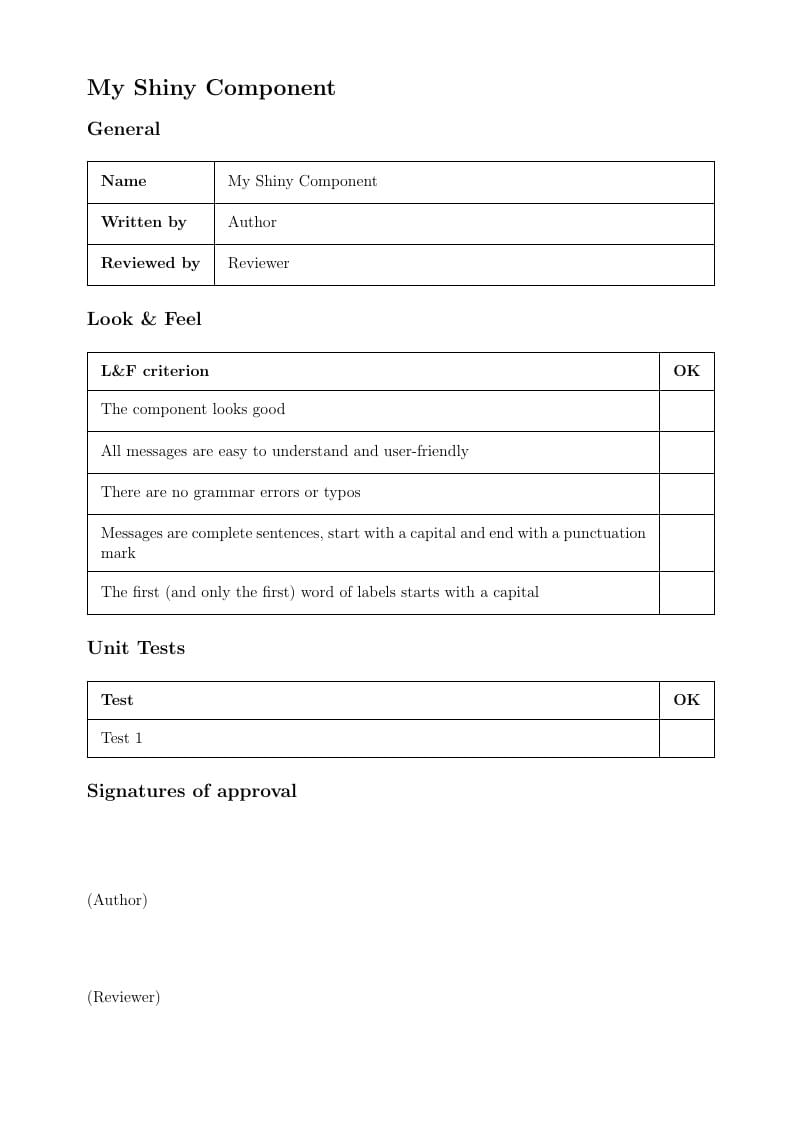
Simple template for approving software components.
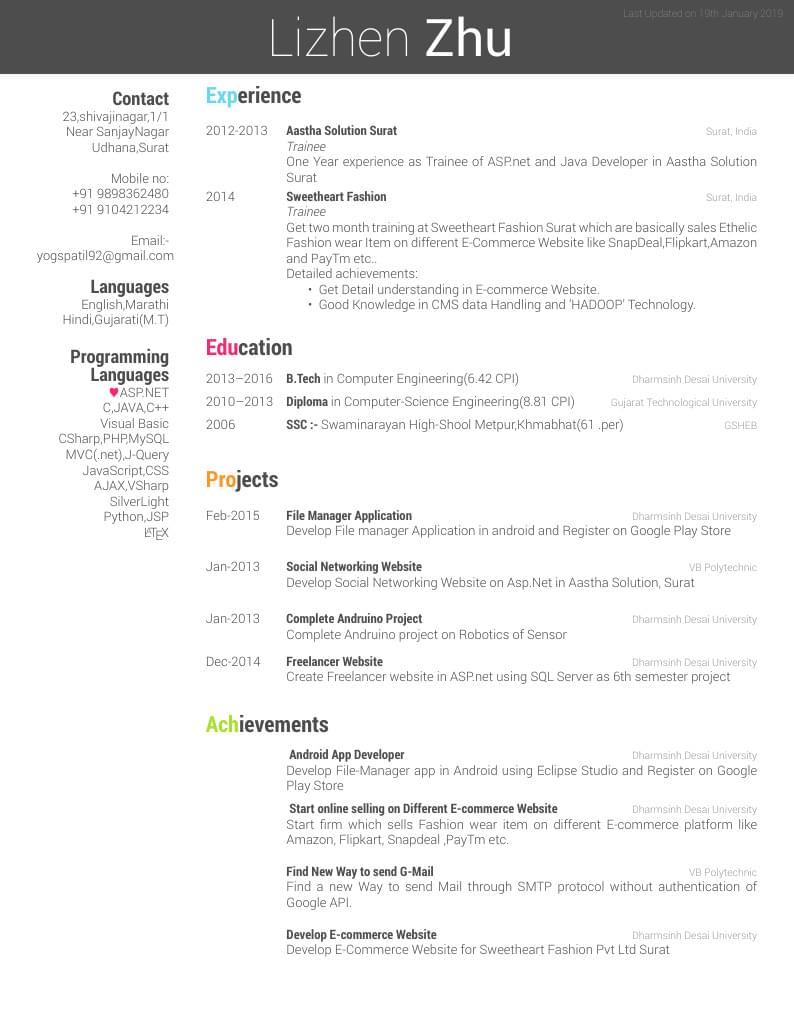
Lizhen Zhu's Resume Created with the Friggeri CV template
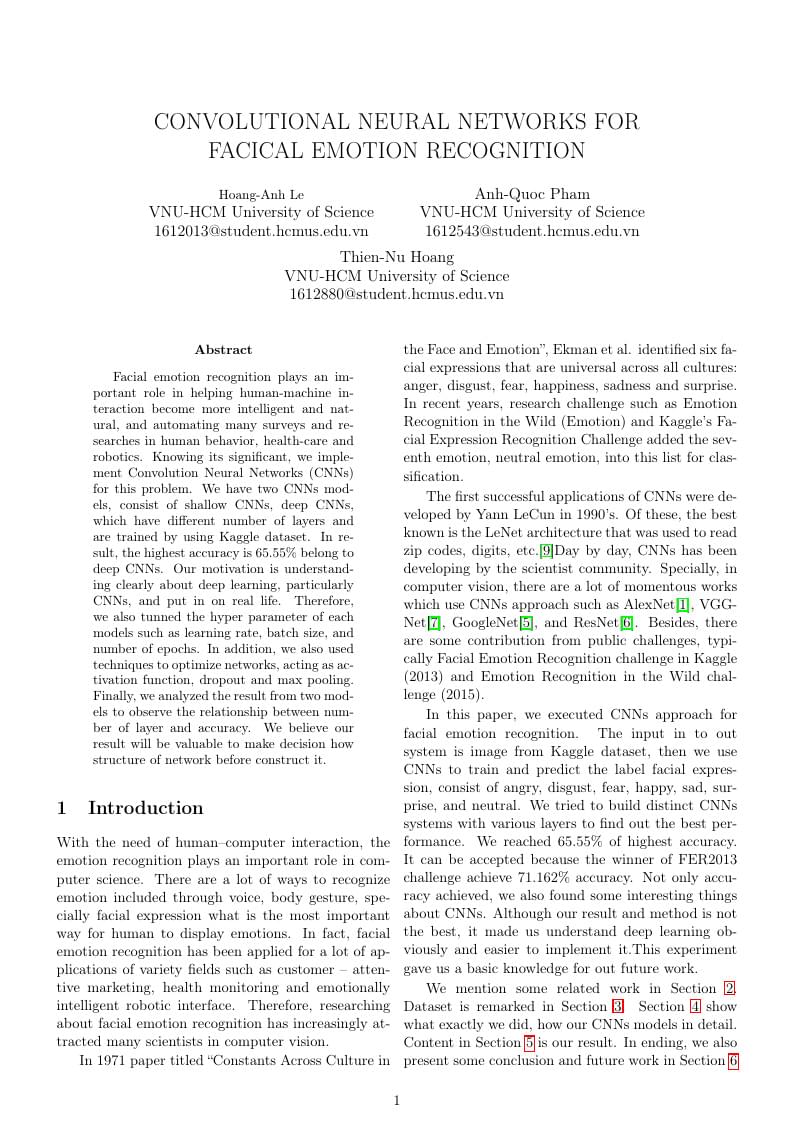
Final Project of the course named Scientific Researching Method. Our project was about emotional recognition
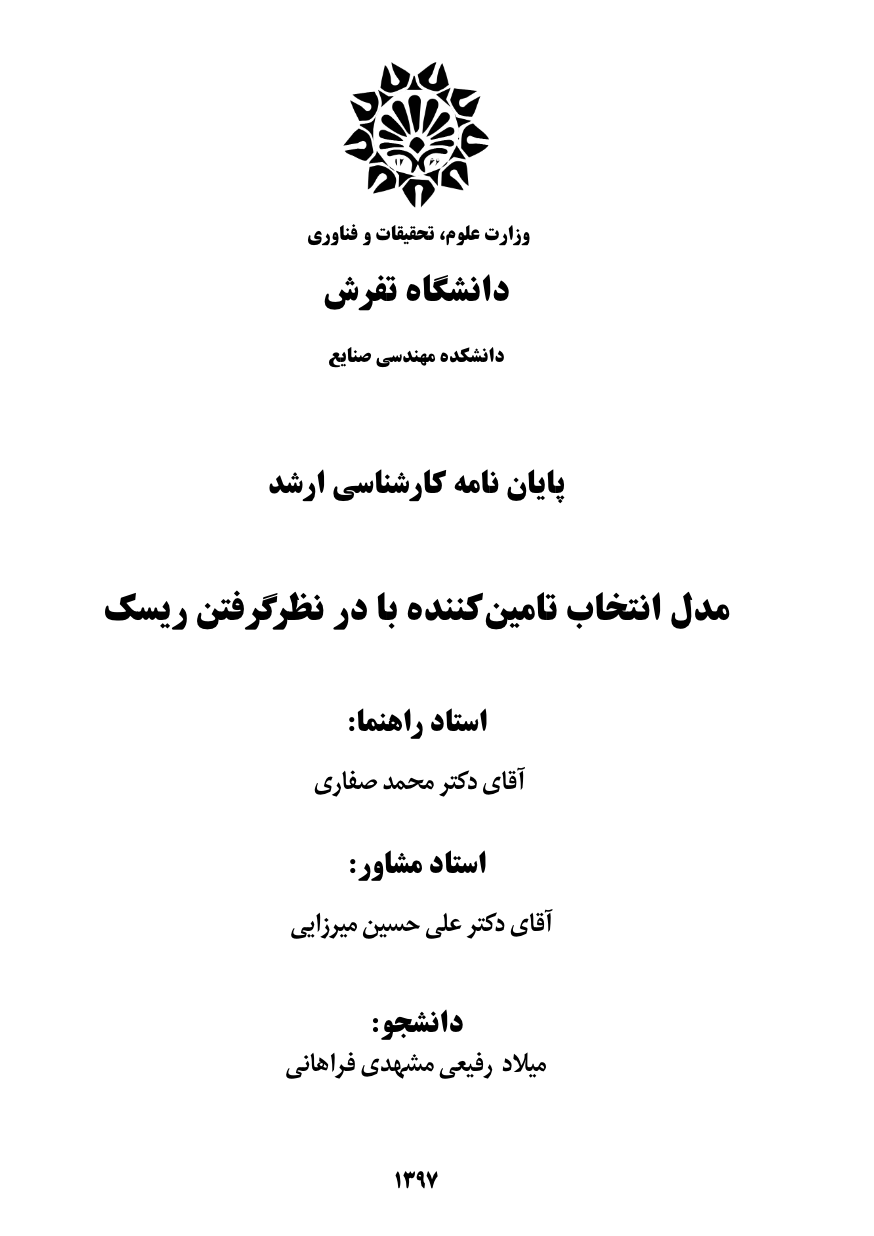
این قالب مربوط به دانشگاه تفرش است.
A discussion essay template for my assignment.
\begin
Discover why over 25 million people worldwide trust Overleaf with their work.