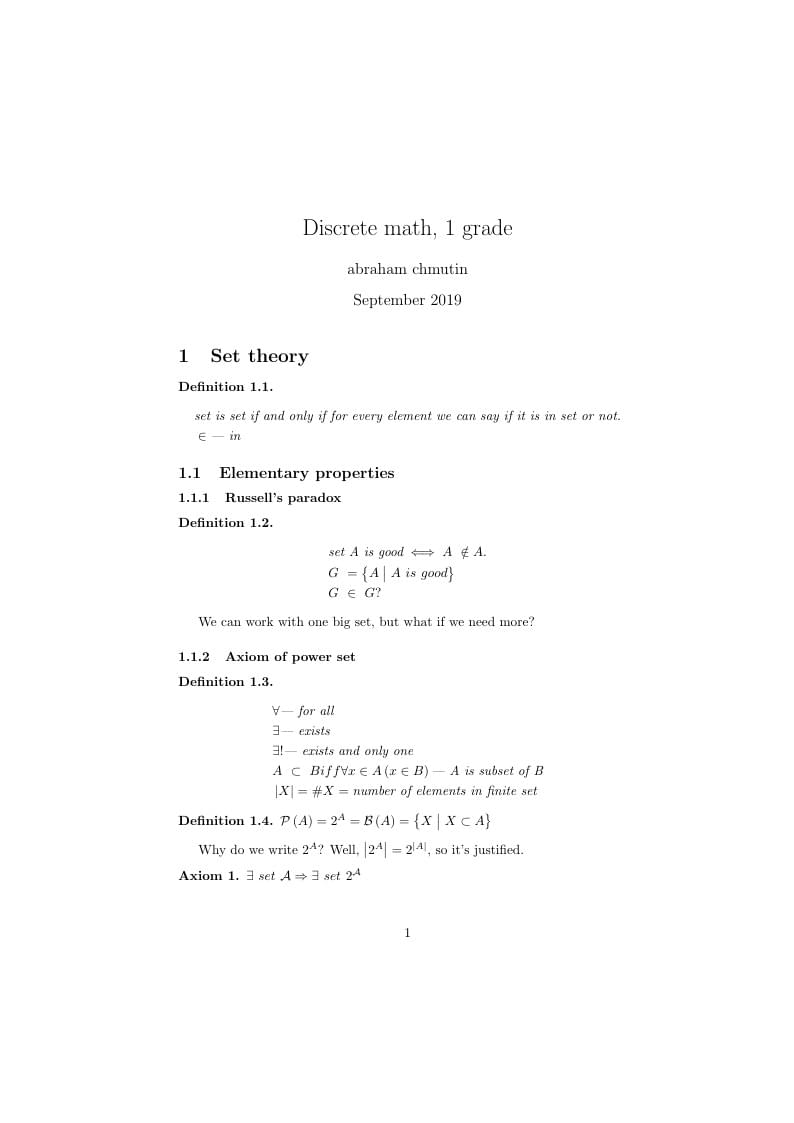
Het kaartspel SET, dat gespeeld wordt met 81 kaarten waarop verschillende geometrische afbeeldingen staan, werd in het begin van de jaren '90 populair en heeft sindsdien ook de belangstelling van wiskundigen gewekt. In dit artikel modelleren we het kaartspel aan de hand van een vierdimensionale vectorruimte over het veld 𝔽3. Deze vectorruimte kunnen we interpreteren als meetkundige ruimte met een eindig aantal punten. Via deze interpretatie worden drie kaarten uit het kaartspel die een set vormen voorgesteld door drie collineaire punten. We proberen in dit artikel een bewijs te geven van de stelling dat de kleinste verzameling van speelkaarten die altijd minstens één set bevat, bestaat uit 21 kaarten. De berekeningen steunen aanvankelijk alleen op combinatorische tellingen en op het duivenhokprincipe. In de laatste bewijzen van dit artikel maken we ook gebruikt van de methode van de dubbele telling.
Dit project over tensegrities past in het thema van de Nacht van de Toren jaargang 2016. Tijdens deze openschoolnacht draait alles rond evenwicht. Tensegrities (in het Nederlands: houtje-touwtje-constructies) zijn composities met zwevende houten staafjes die elkaar niet raken maar die toch in evenwicht blijven door de gepaste trekspanning in de verbindingstouwtjes. Hoewel het assortiment aan kunstzinnige tensigrities zeer groot is, focussen we ons hier slechts op het type waarbij de staafjes een eenbladige hyperboloïde (een ruimtelichaam in de vorm van een koeltoren) afbakenen.
Principal Components Analysis (PCA) and Canonical Correlation Analysis (CCA) are among the methods used in Multivariate Data Analysis. PCA is concerned with explaining the variance-covariance structure of a set of variables through a few linear combinations of these variables. Its general objectives are data reduction and interpretation. CCA seeks to identify and quantify the associations between two sets of variables i.e Pulp fibres and Paper variables.PCA shows that the first PC already exceeds 90% of the total variability. According to the proportion of variability explained by each canonical variable , the results suggest that the first two canonical correlations seem to be sufficient to explain the structure between
Pulp and Paper characteristics with 98.86%. Despite the fact that the first the two canonical
variables keep 98% of common variability, 78% was kept in the pulp fiber set and about
94% of the paper set as a whole. In the proportion of opposite canonical variable,there were
approximately 64% for the paper set of variables and 78% for the pulp fiber set of variables
kept for the two respectively.
The lecture notes are based on Tom Coates' lecture on toric varieties. A few references:
M. Audin, Toric actions on symplectic manifolds
W. Fulton, Toric varieties
Cox-Schenck-Little, Toric varieties
The goal of this project is to explore both the theory behind the Extended Kalman Filter and the way it was used to localize a four-wheeled mobile-robot. This can be achieved by estimating in real-time the pose of the robot, while using a pre-acquired map through Laser Range Finder (LRF). The LRF is used to scan the environment, which is represented through line segments. Through a prediction step, the robot simulates its kinematic model to predict his current position. In order to minimize the difference between the matched lines from the global and local maps, a update step is implemented. It should be noted that every measurement has associated uncertainty that needs to be taken into account when performing each step of the Extended Kalman Filter. These uncertainties, or noise, are described by covariance matrices that play a very important role in the algorithm. Since we are dealing with an indoor structured environment, mainly composed by walls and straight-edged objects, the line segment representation of the maps was the chosen method to approach the problem.