LaTeX templates and examples — TikZ
Recent
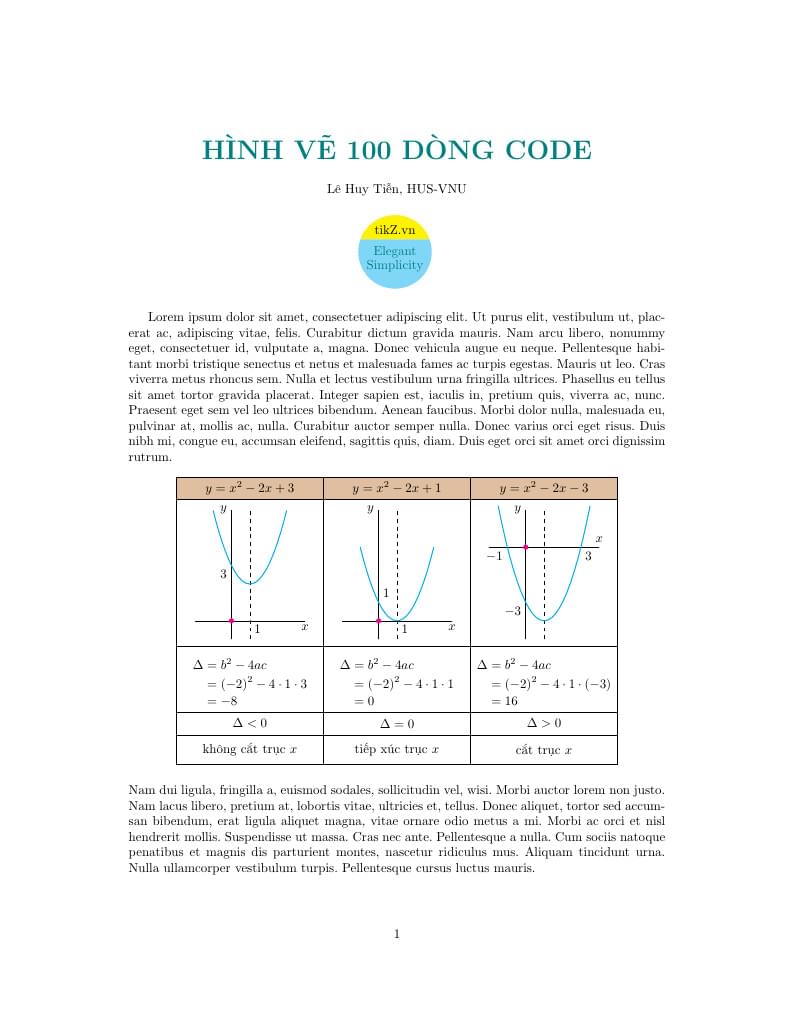
This is a redrawn from [1, page 35] using the 'matrix' library of TikZ. [1] Mathematics HL (Core) 3rd edition
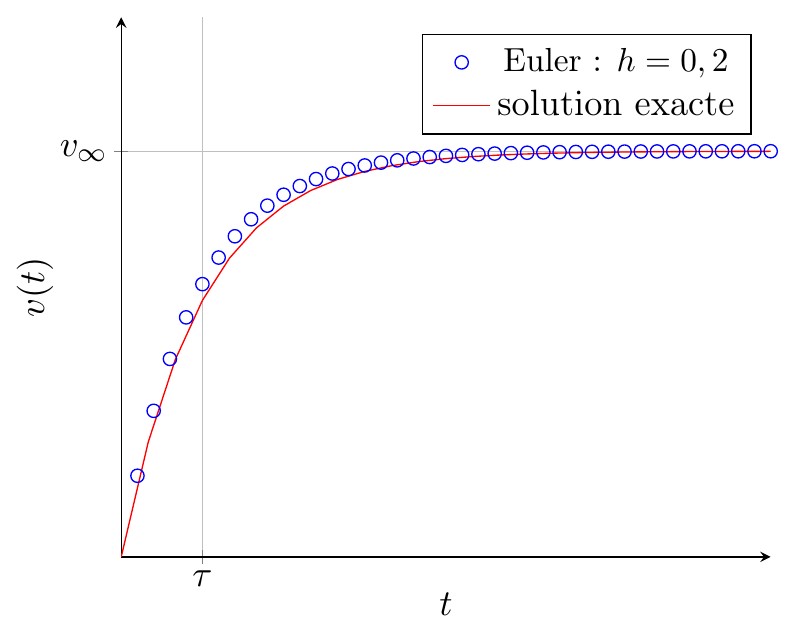
Ce document regroupe les codes TIKZ des figures utilisées pour le cours "traitement numérique des équations différentielles" situé à la page http://femto-physique.fr/analyse_numerique/numerique_C1.php
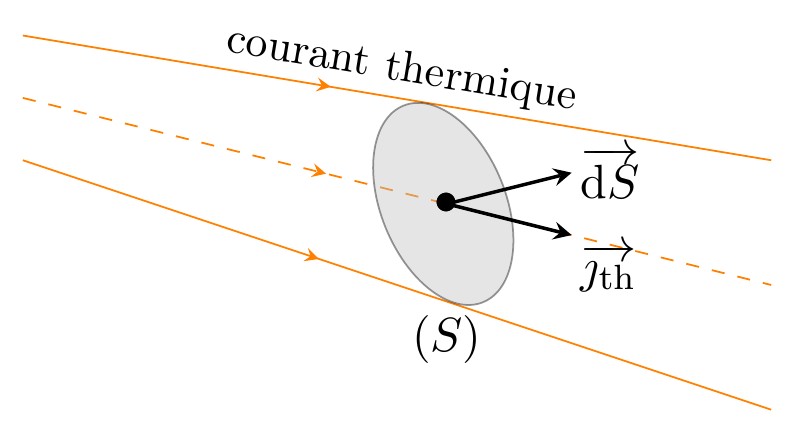
Ce document regroupe les codes TIKZ des figures utilisées pour le cours "TRANSFERTS THERMIQUES" situé à la page http://femto-physique.fr/physique_statistique/phystat_C5.php
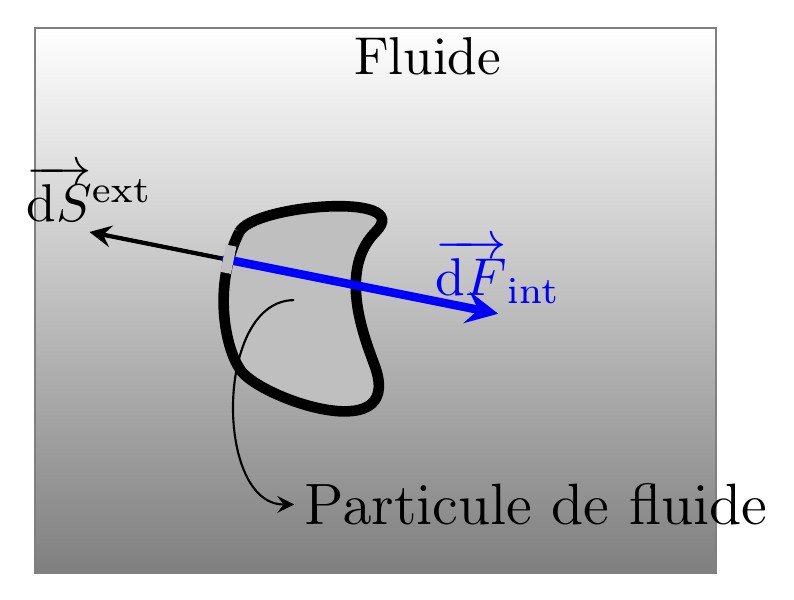
Ce document regroupe les codes TIKZ des figures utilisées pour le cours "DYNAMIQUE DES FUIDES PARFAITS" situé à la page http://femto-physique.fr/mecanique_des_fluides/mecaflu_C2.php
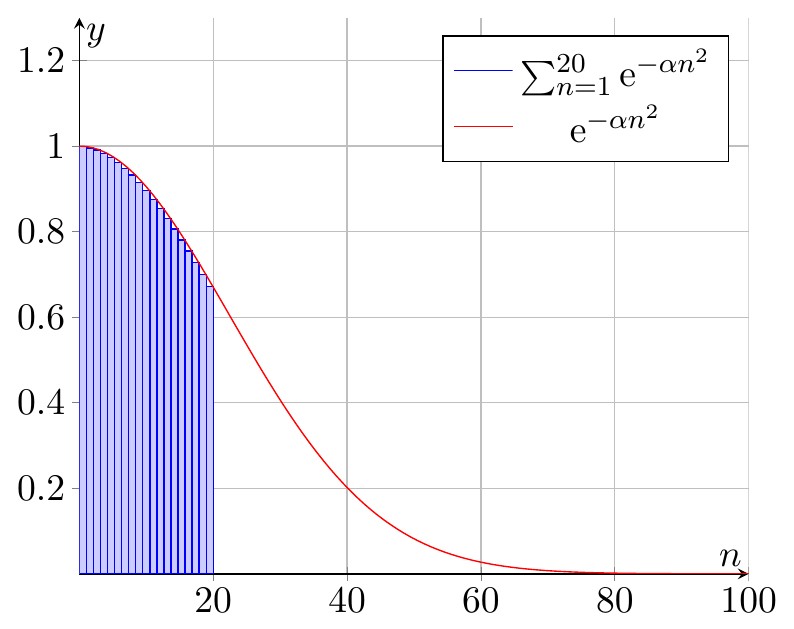
Ce document regroupe les codes TIKZ des figures utilisées pour le cours "Le gaz parfait" situé à la page http://femto-physique.fr/physique_statistique/phystat_C3.php

This Blackboard beamer theme and template was created by Kazuki Maeda <kmaeda@users.sourceforge.jp> for Japanese presentations, but can be used for English (or other European languages) presentations as well. It has been modified to work with XeLaTeX. p/s: The blackboard background was drawn with TikZ; the code is also included in the template.
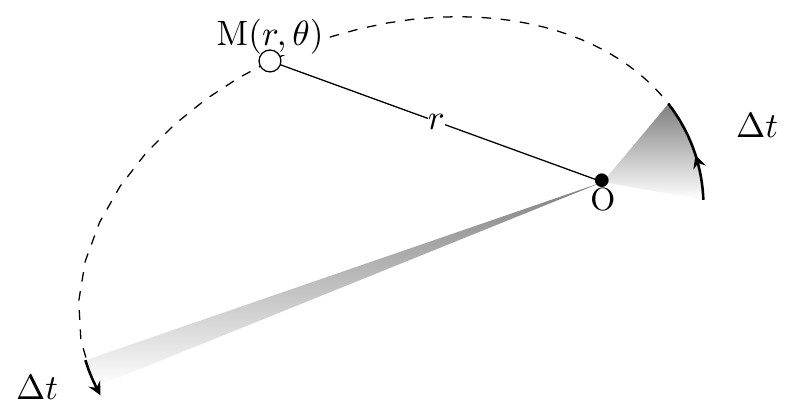
Codes TikZ des figures du cours "Mouvememnts à force centrale" situé à l'adresse : http://www.femto-physique.fr/mecanique/meca_C7.php
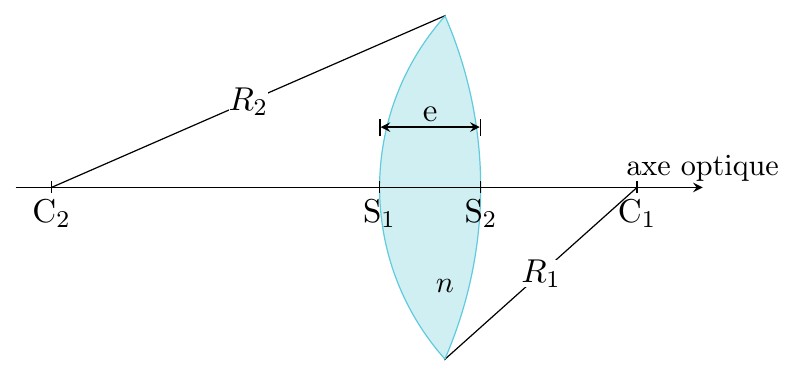
Ce document regroupe les codes TIKZ des figures utilisées pour le cours "Les lentilles minces" situé à la page: http://femto-physique.fr/optique_geometrique/opt_C3.php
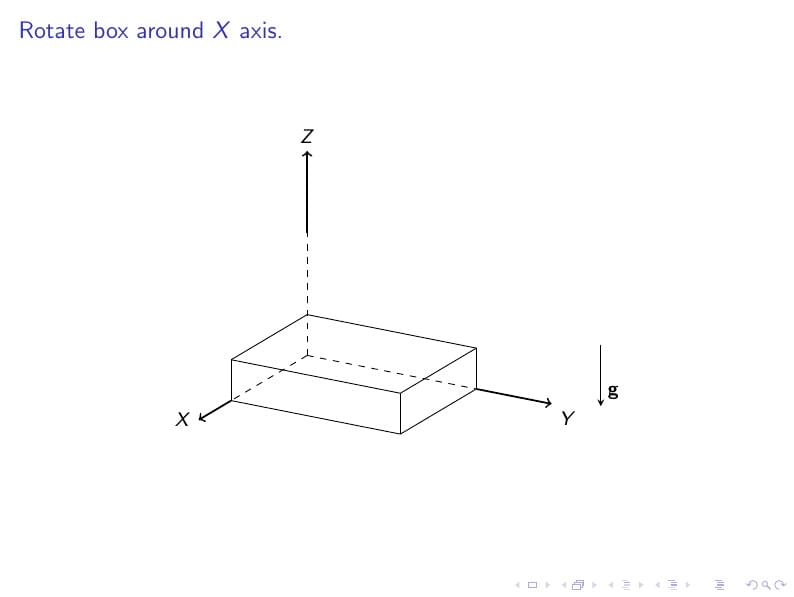
Rotate a box around some axes: X axis, Y axix, Z axis, any axis
\begin
Discover why over 25 million people worldwide trust Overleaf with their work.